You open your favourite finance app or glance at a news channel, and there it is, a rapid stream of letters, numbers, and arrows flying by:
GTCO ₦39.50 ▲ +₦1.20 (+3.13%)
Looks like a secret code, right?
Good news: it’s not a code — it’s simply a way of showing how a company’s stock is performing at that moment. And once you know how to read it, you’ll be able to tell, at a glance, whether a stock is climbing, falling, or just hanging around.
In this guide, we’ll break down a stock quote, explain the most common terms, and walk you through how to make sense of what you’re seeing.
What Is a Stock? (The Very Basics)
A stock is simply a piece of ownership in a company. Think of a business as a big pie. A stock is like a single slice of that pie. If you own shares, you own a part of the business — and you share in its growth (and risks).
Companies sell stocks to raise money. Investors buy them in hopes that the company will grow and the value of their slice will increase. Stocks are bought and sold on stock exchanges — like the Nigerian Stock Exchange (NGX), New York Stock Exchange (NYSE) or NASDAQ in the US, and others worldwide.
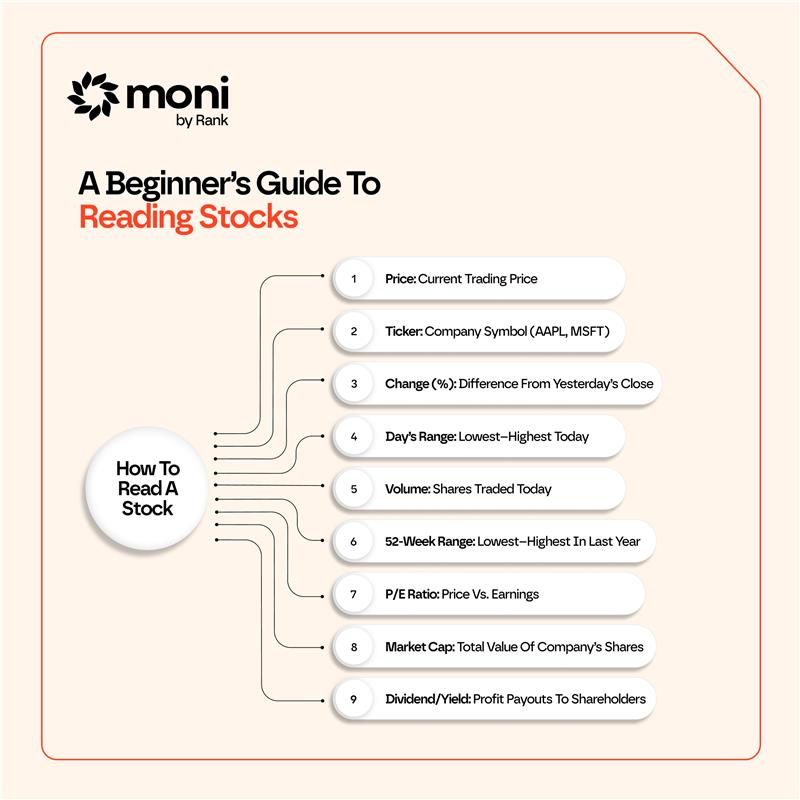
How to Read a Stock Quote
Let’s use a real-world-style example:
ZENITHBANK ₦38.50 ▲ +₦0.90 (+2.39%) Volume: 12.4M
Here’s what each part means:
- Ticker Symbol
This is the short code used to identify a company.
- ZENITHBANK = Zenith Bank Plc
- MTNN = MTN Nigeria
- DANGCEM = Dangote Cement
Think of it as the company’s stock nickname.
2. Current Price
This is the latest price at which the stock traded.
• In our example: ₦38.50 is the price per share right now.
3. Price Change & Percentage Change
Shows how much the price has moved compared to yesterday’s closing price.
• +₦0.90 means the stock rose +₦0.90 from the previous close.
• (+2.39%) is the percentage change.
Green usually means up, red means down.
4. Day’s Range
Lowest and highest prices during the current trading day.
• Example: ₦38.50 – ₦43.50
Shows volatility and trading activity.
5. 52-Week Range
Lowest and highest prices in the last year.
• Example: $280.00 – $355.00
Helps you see where the current price stands in a longer context.
6. Volume
Number of shares traded today.
• Example: 12.4M means 12.4 million shares changed hands.
7. Market Capitalization (Market Cap)
Total value of all shares combined.
Formula: Price × Number of Shares Outstanding.
Total value of all a company’s shares.
- Formula: Price × Total Shares Outstanding.
- On the NGX, large cap companies include Dangote Cement and Airtel Africa.
8. Dividend & Yield
Some companies share profits with shareholders.
- Dividend: Naira amount per share (e.g., ₦2.80 per year).
- Yield: Dividend as a % of the share price.
- Ex-Dividend Date: You must buy the stock before this date to receive the next dividend payout.
9. P/E Ratio (Price-to-Earnings)
Measures how expensive a stock is relative to its earnings.
- High P/E often means investors expect strong growth.
- Low P/E can mean the stock is undervalued (or that growth is slow).
Reading Stock Charts
Charts give a visual view of price movement.
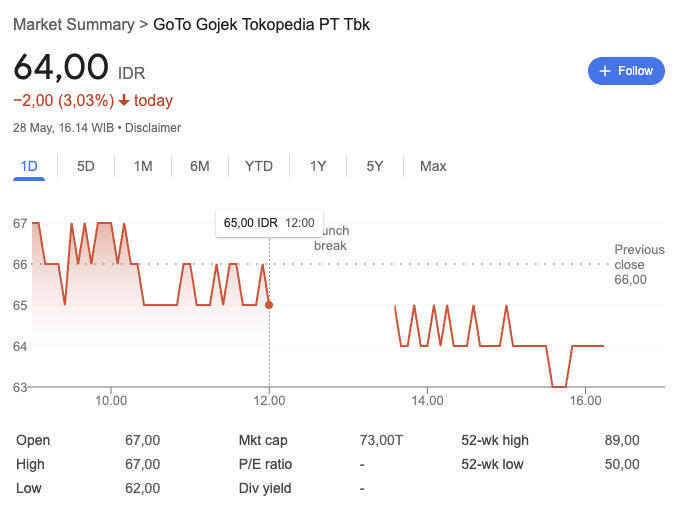
Time Frames
1-day (intraday), 5-day, 1-month, 6-month, 1-year, 5-year, max history.
Types of Charts
- Line chart:
Simple view showing closing prices over time.
- Candlestick chart:
Shows open, close, high, and low prices per time period.
Trends:
- Uptrend = prices rising over time.
- Downtrend = prices falling.
- Sideways = little change.
Key Terms Every Beginner Should Know
- Bull Market: Prices are rising overall.
- Bear Market: Prices are falling.
- Bid Price: Highest price someone’s willing to pay.
- Ask Price: Lowest price someone’s willing to sell for.
- Spread: Difference between bid and ask.
- Volatility: How much a stock price swings.
- Blue-Chip Stock: Large, stable, established companies.
A Practical NGX Example Walkthrough
Imagine opening an NGX market summary and seeing:
MTNN ₦232.00 ▲ +₦5.00 (+2.20%)
Day’s Range: ₦227.00 – ₦233.50
52-Week Range: ₦180.00 – ₦240.00
Volume: 3.1M
Market Cap: ₦4.7T
P/E: 15.4
Dividend/Yield: ₦12.00 (5.17%)
Ex-Dividend Date: April 10, 2025
Beta: 0.85
EPS (TTM): ₦15.06
1-Year Target: ₦245.00
50-Day SMA: ₦228.50
200-Day SMA: ₦215.00
You could interpret this as: MTNN’s share price is currently ₦232, up ₦5 today. It’s close to its 52-week high. Trading volume is moderate at 3.1 million shares. It’s a large-cap company with solid earnings, a healthy dividend yield, and relatively low volatility.